E Debugging R Code
R comes with a simple set of debugging tools that RStudio amplifies. You can use these tools to better understand code that produces an error or returns an unexpected result. Usually this will be your own code, but you can also examine the functions in R or one of its packages.
Debugging code can take as much creativity and insight as writing code. There is no guarantee that you will find a bug or be able to fix it when you do. However, you can help yourself by using R’s debugging tools. These include the traceback, browser, debug, debugonce, trace, and recover functions.
Using these tools is usually a two-step process. First, you locate where an error occurred. Then you try to determine why it occurred. You can do the first step with R’s traceback function.
E.1 traceback
The traceback tool pinpoints the location of an error. Many R functions call other R functions, which call other functions, and so on. When an error occurs, it may not be clear which of these functions went wrong. Let’s consider an example. The following functions call one another, and the last function creates an error (you’ll see why in a second):
first <- function() second()
second <- function() third()
third <- function() fourth()
fourth <- function() fifth()
fifth <- function() bug()
When you run first, it will call second, which will call third, which will call fourth, which will call fifth, which will call bug, a function that does not exist. Here’s what that will look like at the command line:
first()
##  Error in fifth() : could not find function "bug"
The error report tells us that the error occurred when R tried to run fifth. It also tells us the nature of the error (there is no function called bug). Here, it is obvious why R calls fifth, but it might not be so obvious why R calls a function when an error occurs in the wild.
You can see the path of functions that R called before it hit an error by typing traceback() at the command line. traceback will return a call stack, a list of the functions that R called in the order that it called them. The bottom function will be the command that you entered in the command line. The top function will be the function that caused the error:
traceback()
## 5: fifth() at #1
## 4: fourth() at #1
## 3: third() at #1
## 2: second() at #1
## 1: first()
traceback will always refer to the last error you encountered. If you would like to look at a less recent error, you will need to recreate it before running traceback.
How can this help you? First, traceback returns a list of suspects. One of these functions caused the error, and each function is more suspicious than the ones below it. Chances are that our bug came from fifth (it did), but it is also possible that an earlier function did something odd—like call fifth when it shouldn’t have.
Second, traceback can show you if R stepped off the path that you expected it to take. If this happened, look at the last function before things went wrong.
Third, traceback can reveal the frightening extent of infinite recursion errors. For example, if you change fifth so that it calls second, the functions will make a loop: second will call third, which will call fourth, which will call fifth, which will call second and start the loop over again. It is easier to do this sort of thing in practice than you might think:
fifth <- function() second()When you call first(), R will start to run the functions. After awhile, it will notice that it is repeating itself and will return an error. traceback will show just what R was doing:
first()
## Error: evaluation nested too deeply: infinite recursion/options(expressions=)?

traceback()
## 5000: fourth() at #1
## 4999: third() at #1
## 4998: second() at #1
## 4997: fifth() at #1
## 4996: fourth() at #1
## 4995: third() at #1
## 4994: second() at #1
## 4993: fifth() at #1
## ...
Notice that there are 5,000 lines of output in this traceback. If you are using RStudio, you will not get to see the traceback of an infinite recursion error (I used the Mac GUI to get this output). RStudio represses the traceback for infinite recursion errors to prevent the large call stacks from pushing your console history out of R’s memory buffer. With RStudio, you will have to recognize the infinite recursion error by its error message. However, you can still see the imposing traceback by running things in a UNIX shell or the Windows or Mac GUIs.
RStudio makes it very easy to use traceback. You do not even need to type in the function name. Whenever an error occurs, RStudio will display it in a gray box with two options. The first is Show Traceback, shown in Figure E.1.
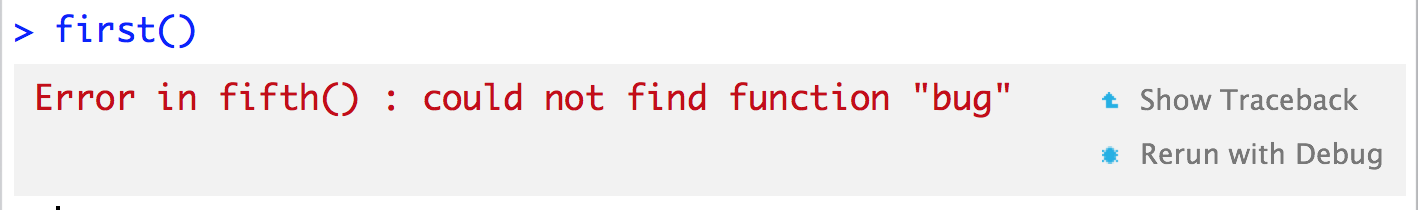
Figure E.1: RStudio’s Show Traceback option.
If you click Show Traceback, RStudio will expand the gray box and display the traceback call stack, as in Figure E.2. The Show Traceback option will persist beside an error message in your console, even as you write new commands. This means that you can go back and look at the call stacks for all errors—not just the most recent error.
Imagine that you’ve used traceback to pinpoint a function that you think might cause a bug. Now what should you do? You should try to figure out what the function did to cause an error while it ran (if it did anything). You can examine how the function runs with browser.
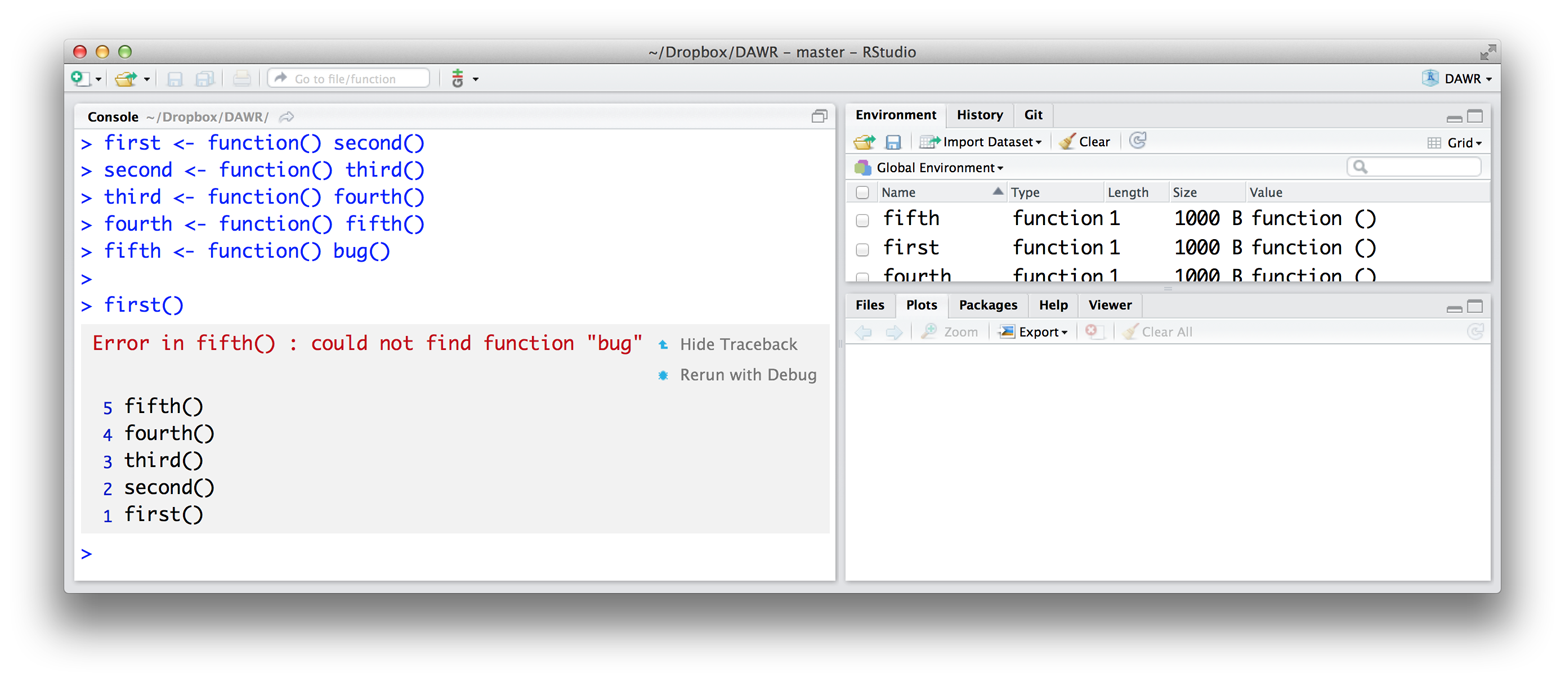
Figure E.2: RStudio’s Traceback display.
E.2 browser
You can ask R to pause in the middle of running a function and give control back to you with browser. This will let you enter new commands at the command line. The active environment for these commands will not be the global environment (as usual); it will be the runtime environment of the function that you have paused. As a result, you can look at the objects that the function is using, look up their values with the same scoping rules that the function would use, and run code under the same conditions that the function would run it in. This arrangement provides the best chance for spotting the source of bugs in a function.
To use browser, add the call browser() to the body of a function and then resave the function. For example, if I wanted to pause in the middle of the score function from Programs, I could add browser() to the body of score and then rerun the following code, which defines score:
score <- function (symbols) {
  # identify case
  same <- symbols[1] == symbols[2] && symbols[2] == symbols[3]
  bars <- symbols %in% c("B", "BB", "BBB")

  # get prize
  if (same) {
    payouts <- c("DD" = 100, "7" = 80, "BBB" = 40, "BB" = 25,
      "B" = 10, "C" = 10, "0" = 0)
    prize <- unname(payouts[symbols[1]])
  } else if (all(bars)) {
    prize <- 5
  } else {
    cherries <- sum(symbols == "C")
    prize <- c(0, 2, 5)[cherries + 1]
  }

  browser()

  # adjust for diamonds
  diamonds <- sum(symbols == "DD")
  prize * 2 ^ diamonds
}
Now whenever R runs score, it will come to the call browser(). You can see this with the play function from Programs. If you don’t have play handy, you can access it by running this code:
get_symbols <- function() {
  wheel <- c("DD", "7", "BBB", "BB", "B", "C", "0")
  sample(wheel, size = 3, replace = TRUE,
    prob = c(0.03, 0.03, 0.06, 0.1, 0.25, 0.01, 0.52))
}

play <- function() {
  symbols <- get_symbols()
  structure(score(symbols), symbols = symbols, class = "slots")
}
When you run play, play will call get_symbols and then score. As R works through score, it will come across the call to browser and run it. When R runs this call, several things will happen, as in Figure E.3. First, R will stop running score. Second, the command prompt will change to browser[1]> and R will give me back control; I can now type new commands in at the new command prompt. Third, three buttons will appear above the console pane: Next, Continue, and Stop. Fourth, RStudio will display the source code for score in the scripts pane, and it will highlight the line that contains browser(). Fifth, the environments tab will change. Instead of revealing the objects that are saved in the global environment, it will reveal the objects that are saved in the runtime environment of score (see Environments for an explanation of R’s environment system). Sixth, RStudio will open a new Traceback pane, which shows the call stack RStudio took to get to browser. The most recent function, score, will be highlighted.
I’m now in a new R mode, called browser mode. Browser mode is designed to help you uncover bugs, and the new display in RStudio is designed to help you navigate this mode.
Any command that you run in browser mode will be evaluated in the context of the runtime environment of the function that called browser. This will be the function that is highlighted in the new Traceback pane. Here, that function is score. So while we are in browser mode, the active environment will be score’s runtime environment. This lets you do two things.
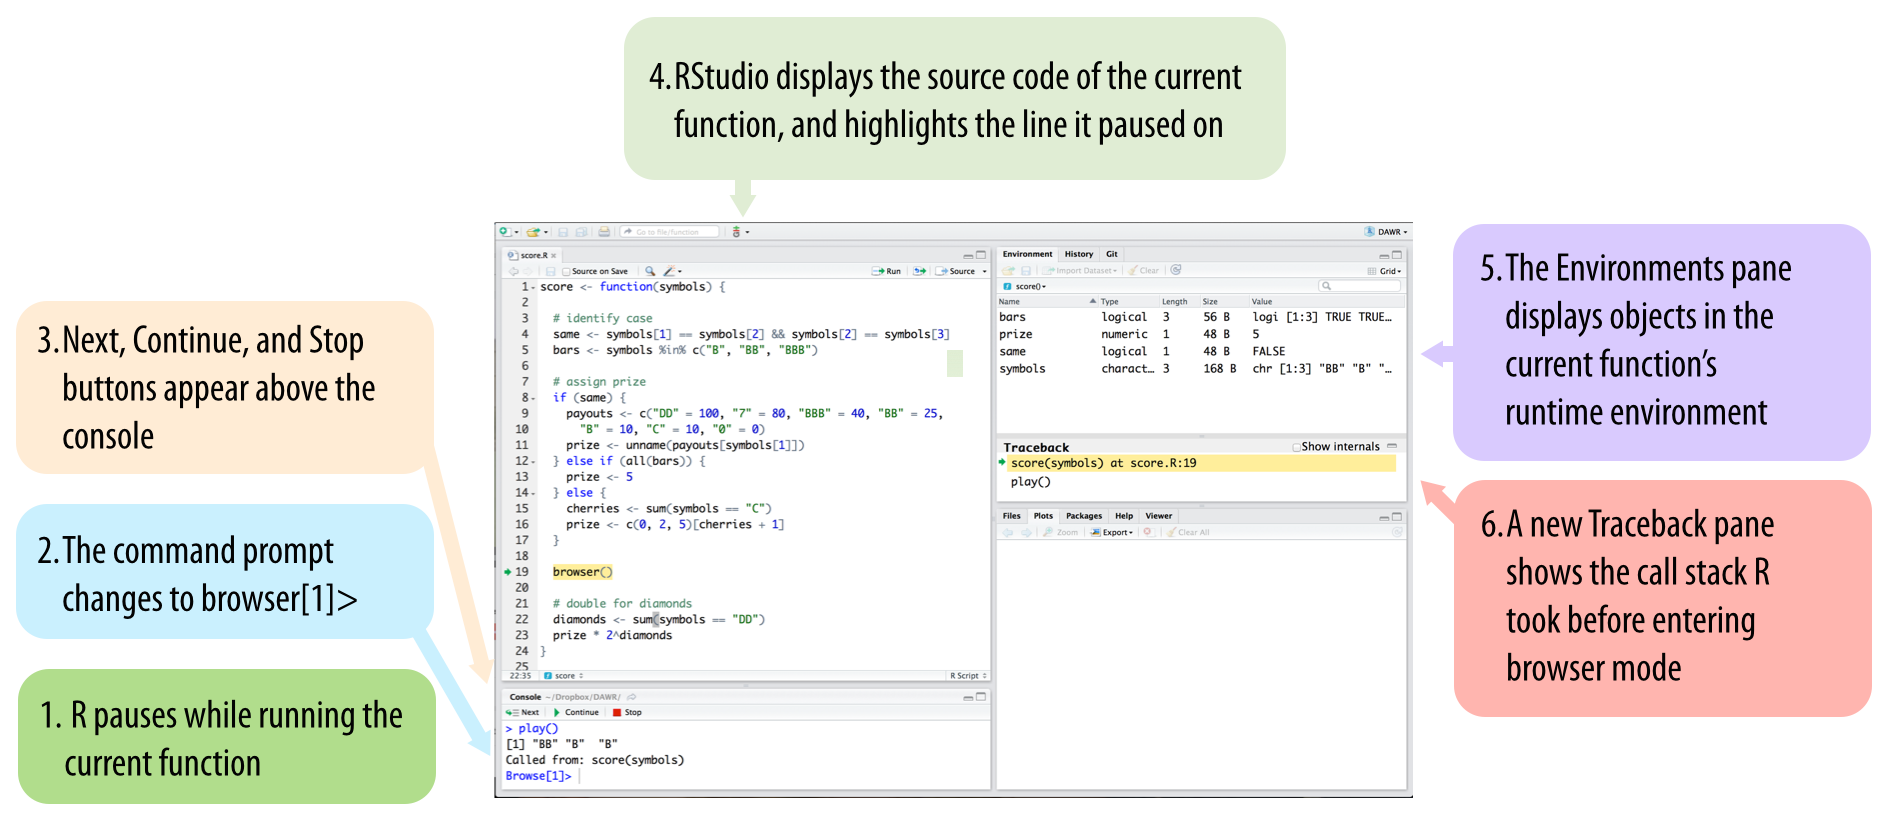
Figure E.3: RStudio updates its display whenever you enter browser mode to help you navigate the mode.
First, you can inspect the objects that score uses. The updated Environments pane shows you which objects score has saved in its local environment. You can inspect any of them by typing their name at the browser prompt. This gives you a way to see the values of runtime variables that you normally would not be able to access. If a value looks clearly wrong, you may be close to finding a bug:
Browse[1]> symbols
## [1] "B" "B" "0"

Browse[1]> same
## [1] FALSE
Second, you can run code and see the same results that score would see. For example, you could run the remaining lines of the score function and see if they do anything unusual. You could run these lines by typing them into the command prompt, or you could use the three navigation buttons that now appear above the prompt, as in Figure E.4.
The first button, Next, will run the next line of code in score. The highlighted line in the scripts pane will advance by one line to show you your new location in the score function. If the next line begins a code chunk, like a for loop or an if tree, R will run the whole chunk and will highlight the whole chunk in the script window.
The second button, Continue, will run all of the remaining lines of score and then exit the browser mode.
The third button, Stop, will exit browser mode without running any more lines of score.
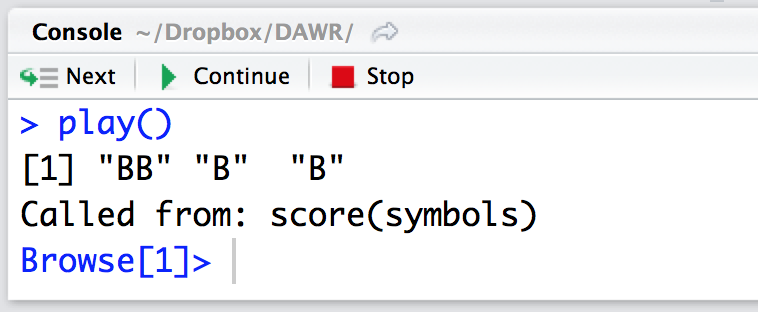
Figure E.4: You can navigate browser mode with the three buttons at the top of the console pane.
You can do the same things by typing the commands n, c, and Q into the browser prompt. This creates an annoyance: what if you want to look up an object named n, c, or Q? Typing in the object name will not work, R will either advance, continue, or quit the browser mode. Instead you will have to look these objects up with the commands get("n"), get("c"), and get("Q"). cont is a synonym for c in browser mode and where prints the call stack, so you’ll have to look up these objects with get as well.
Browser mode can help you see things from the perspective of your functions, but it cannot show you where the bug lies. However, browser mode can help you test hypotheses and investigate function behavior. This is usually all you need to spot and fix a bug. The browser mode is the basic debugging tool of R. Each of the following functions just provides an alternate way to enter the browser mode.
Once you fix the bug, you should resave your function a third time—this time without the browser() call. As long as the browser call is in there, R will pause each time you, or another function, calls score.
E.3 Break Points
RStudio’s break points provide a graphical way to add a browser statement to a function. To use them, open the script where you’ve defined a function. Then click to the left of the line number of the line of code in the function body where you’d like to add the browser statement. A hollow red dot will appear to show you where the break point will occur. Then run the script by clicking the Source button at the top of the Scripts pane. The hollow dot will turn into a solid red dot to show that the function has a break point (see Figure E.5).
R will treat the break point like a browser statement, going into browser mode when it encounters it. You can remove a break point by clicking on the red dot. The dot will disappear, and the break point will be removed.
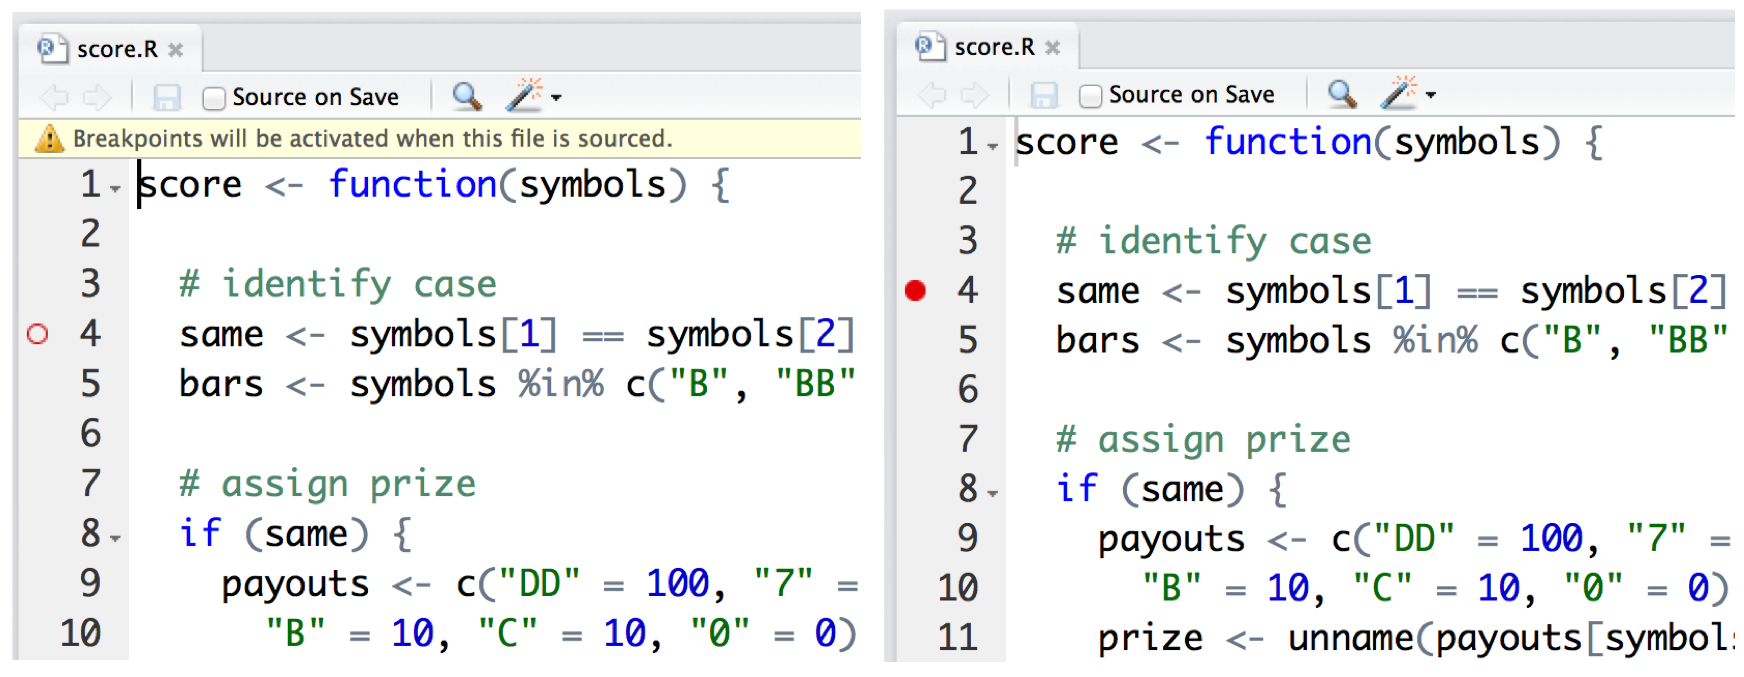
Figure E.5: Break points provide the graphical equivalent of a browser statement.
Break points and browser provide a great way to debug functions that you have defined. But what if you want to debug a function that already exists in R? You can do that with the debug function.
E.4 debug
You can “add” a browser call to the very start of a preexisting function with debug. To do this, run debug on the function. For example, you can run debug on sample with:
debug(sample)Afterward, R will act as if there is a browser() statement in the first line of the function. Whenever R runs the function, it will immediately enter browser mode, allowing you to step through the function one line at a time. R will continue to behave this way until you “remove” the browser statement with undebug:
undebug(sample)You can check whether a function is in “debugging” mode with isdebugged. This will return TRUE if you’ve ran debug on the function but have yet to run undebug:
isdebugged(sample)
## FALSE
If this is all too much of a hassle, you can do what I do and use debugonce instead of debug. R will enter browser mode the very next time it runs the function but will automatically undebug the function afterward. If you need to browse through the function again, you can just run debugonce on it a second time.
You can recreate debugonce in RStudio whenever an error occurs. “Rerun with debug” will appear in the grey error box beneath Show Traceback (Figure E.1). If you click this option, RStudio will rerun the command as if you had first run debugonce on it. R will immediately go into browser mode, allowing you to step through the code. The browser behavior will only occur on this run of the code. You do not need to worry about calling undebug when you are done.
E.5 trace
You can add the browser statement further into the function, and not at the very start, with trace. trace takes the name of a function as a character string and then an R expression to insert into the function. You can also provide an at argument that tells trace at which line of the function to place the expression. So to insert a browser call at the fourth line of sample, you would run:
trace("sample", browser, at = 4)You can use trace to insert other R functions (not just browser) into a function, but you may need to think of a clever reason for doing so. You can also run trace on a function without inserting any new code. R will prints trace:<the function> at the command line every time R runs the function. This is a great way to test a claim I made in S3, that R calls print every time it displays something at the command line:
trace(print)

first
## trace: print(function () second())
## function() second()

head(deck)
## trace: print
##    face   suit value
## 1  king spades    13
## 2 queen spades    12
## 3  jack spades    11
## 4   ten spades    10
## 5  nine spades     9
## 6 eight spades     8
You can revert a function to normal after calling trace on it with untrace:
untrace(sample)
untrace(print)
E.6 recover
The recover function provides one final option for debugging. It combines the call stack of traceback with the browser mode of browser. You can use recover just like browser, by inserting it directly into a function’s body. Let’s demonstrate recover with the fifth function:
fifth <- function() recover()When R runs recover, it will pause and display the call stack, but that’s not all. R gives you the option of opening a browser mode in any of the functions that appear in the call stack. Annoyingly, the call stack will be displayed upside down compared to traceback. The most recent function will be on the bottom, and the original function will be on the top:
first()
##
## Enter a frame number, or 0 to exit
##
## 1: first()
## 2: #1: second()
## 3: #1: third()
## 4: #1: fourth()
## 5: #1: fifth()
To enter a browser mode, type in the number next to the function in whose runtime environment you would like to browse. If you do not wish to browse any of the functions, type 0:
3
## Selection: 3
## Called from: fourth()
## Browse[1]>
You can then proceed as normal. recover gives you a chance to inspect variables up and down your call stack and is a powerful tool for uncovering bugs. However, adding recover to the body of an R function can be cumbersome. Most R users use it as a global option for handling errors.
If you run the following code, R will automatically call recover() whenever an error occurs:
options(error = recover)This behavior will last until you close your R session, or reverse the behavior by calling:
options(error = NULL)